I don’t usually include graphics in my articles, but thought I would make an exception today. I believe the graphics I’m including will help others to visualize the many thousands of words I usually rely on.
First, to restate the specific case I allege in the COMEX silver manipulation, I contend that the excessive concentrated short position held by the 4 and 8 largest traders in COMEX silver futures is why silver is as depressed in price as it is. However, it is not simply a matter that silver has the largest short position in terms of raw numbers of contracts or as a percentage of total open interest, as there are other commodities with larger concentrated short positions on those measures alone. That’s because the contract size of each commodity varies, both in the quantity of the commodity involved and how much each contract is worth in dollar terms.
What makes the concentrated short position in COMEX silver stand head and shoulders above any other commodity is what happens when one “normalizes” the short positions of all commodities by the one common denominator that unites all world commodities. That common denominator is world production. After all, every world commodity is produced and consumed and the only way of legitimately determining if a concentrated position, short or long, is out of bounds with other commodities is by reducing the measurement so that it equalizes the others in objective terms. Remember, commodity futures contracts are derivatives of and to actual world production.
To be clear, I’m not much interested in total open interest, or the gross total long or short position in commodity derivative contracts (as many others seem to be), because total open interest involves thousands of traders on either side of the market and the more traders there are, the freer the market would appear to be. Nor am I interested in total trading volume, as I’m convinced 95% or more of such trading is rapid-fire computer-generated day trading which doesn’t involve overnight position taking.
My main interest is in the concentrated short position of just a handful of traders on the COMEX because you can’t have a manipulation without a concentrated position. Those aren’t just my words; that’s the reason the CFTC calculates and publishes concentration data in its weekly Commitments of Traders (COT) reports on all markets. Therefore, it would seem mandatory that if one were to allege a price manipulation, proving a concentrated position existed would be the first order of business. No concentrated position, no manipulation – period.
And while I would argue that COMEX silver having the largest concentrated short position of any other commodity, when normalized by comparing the one thing that all commodities have in common – actual production – means that silver is automatically manipulated by that concentrated position, the proof doesn’t stop there.
When the entire commercial net short position of a commodity is held by just a handful of traders, as is the case in COMEX silver, the question of the motivation of those few traders must be asked. Let’s face it, with virtually the whole world bullish on silver (try to find a legitimate bearish argument), since the entire commercial net short position is held and has been held for years by 8 or fewer traders on the COMEX, uncovering the reason for their extremely concentrated short position should be paramount. Yet, as important as it would be for an explanation to be forthcoming, none is ever offered – nor even asked for by the regulators. Heck, if there’s a good and legitimate reason for why silver has the largest concentrated short position of all commodities, it should be forthcoming. That no such explanation is given sets off obvious red flags and warnings.
I’m going to present three graphics to show why silver is the most manipulated market of all, but before I do, please understand that the downward manipulation in silver is the also the single most compelling reason to be wildly bullish on its price prospects. Proving that the price of silver is artificially priced lower than it should be by the concentrated short position on the COMEX, is the single most bullish argument one can make, since all manipulations end suddenly and violently in the opposite direction to the manipulation. I like to think of the following graphics as the ghosts of the silver manipulation, past, present, and future.
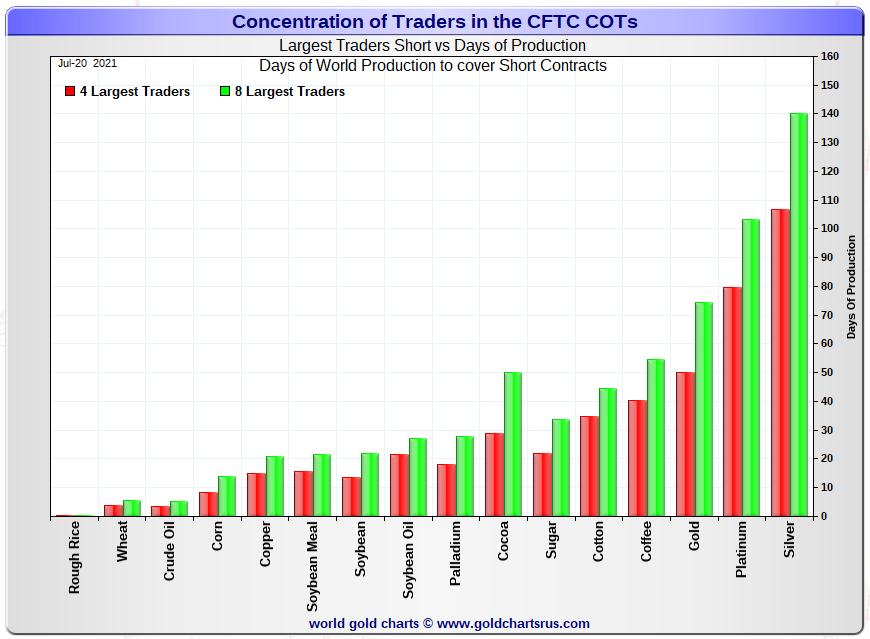
Let me start with the present. By the way, all charts are courtesy of Nick Laird from Gold Charts R Us, where I believe I am the first and continuous subscriber to his service. In fact, the geneses for the charts themselves comes from my research into concentration and the breakdown of the various categories in the COT report. This is a chart I am sure most are familiar with that depicts the concentrated short positions of the most-popular traded commodities on which COT data exist.
Nick breaks down the total annual production of each commodity and divides the total by 365 to get the production by day and then compares that to the concentrated short positions in each commodity after adjusting the contract size and number of contracts to real world quantities. The calculation process is straightforward and normalizes the concentrated short positions in each commodity in objectively-measurable terms, which explains why the format has existed for many years.

A couple of notes on this first chart. It is truly a depiction of the present situation in that it is based upon data in the most current COT report, as of July 20, and indicates silver has the largest concentrated short position of all commodities in actual production terms, with the 8 largest traders holding approximately 140 days of silver world production short, much greater than in any other commodity. But just six months earlier, the number of days production the 8 big shorts held in silver was 180 days, which wouldn’t be reflected in this snapshot.
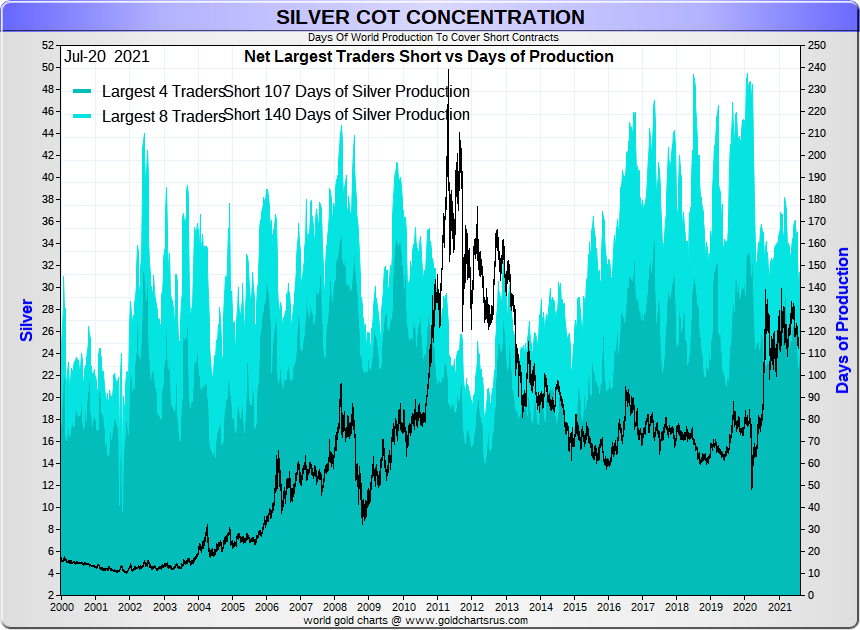
Along those same lines, the next chart depicts the history of the concentrated short position on silver, which over the past 35 years has always had the largest concentrated short position of any commodity – save for palladium on a few occasions (more on that in a moment). This is the graphic of the ghost of silver past and covers the past 20 years of the price set against the concentrated short position. While there have been ebbs and flows in both the price and level of the concentrated short position, a close review of the data will indicate silver prices were most high when the concentrated short position was lowest and vice versa.

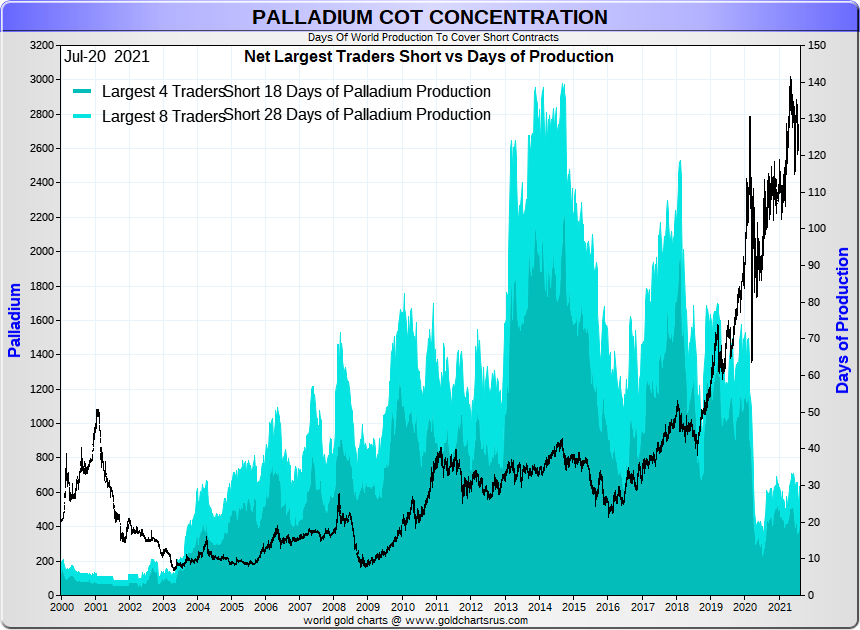
The third graphic is that of the ghost of silver future. Somewhat ironically, this chart of the future of silver is actually that of palladium in the past (since graphics of the future are near impossible to construct). The point here is what happened to palladium prices when its concentrated short position fell from sky-high levels to more normal levels. When palladium had a concentrated short position of 120 to 140 days of world production, its price was cheap (under $500 to $1000). Now that the concentrated short position in palladium is down to less than 30 days of world production (about mid-point for most commodities), its price is closer to $3000. Moreover, no one can say palladium prices are cheap now, as compared to other metals, including gold, silver, platinum and others, palladium is near all-time relative extremes.

The point here is that what happened to palladium prices as its concentrated short position fell to levels common to other commodities is exactly what will happen to silver prices once its concentrated short position falls to more normal levels. Obviously, this is part and parcel with my expectation that the big shorts will refrain from adding aggressively to new shorts on the next rally – which is exactly what happened in palladium. In fact, I am hard-pressed to come up with any other conclusion to the set of charts depicted here.
As indicated previously, if there is any legitimate explanation for why silver has the largest concentrated short position of any commodity, it would have been forthcoming by now. The fact is that no such legitimate explanation exists or is possible. I’m asked often about when I believe the silver manipulation will end and truth be told, no one can accurately time future events. But I do believe I can tell you how the silver manipulation will end – it will end when the big shorts stop adding to short positions aggressively on the next rally. This is exactly what happened in palladium and what will occur in silver. I do think that time is close at hand.
Turning to other matters, the new short interest report on stocks was issued for positions as of July 15, and indicated a further increase in the short interest on SLV, the big silver ETF, of nearly 1.8 million shares to 30.8 million shares/ounces. This is the largest short position on SLV in quite some time and puts the percentage of shorts to total shares outstanding to 5.15% – not outrageous in stock shorting generally, but high in recent terms in SLV.
https://www.wsj.com/market-data/quotes/etf/SLV
I wasn’t expecting a reduction (nor an increase) in this short report because prices were quite stable through the 15th, falling sharply on the 16th and thereafter. However, if there isn’t a significant reduction in the next short report, scheduled for release on Aug 10 (for positions as of July 30), I will be surprised. After all, one of the key prospectus changes back in February for SLV, was the warning to shorts not to get too heavily short in SLV. The fact that the short position in SLV is as high as it is in the face of that clear warning tells me the reason for such a large short position currently in SLV is because the physical availability of metal just isn’t sufficient to allow it to be deposited – very bullish in my eyes.
The key feature of the past couple of days, of course, is the continued rotten price action in silver; specifically, the large price blast to the downside yesterday on the cutoff day for this Friday’s COT report. While I’m not particularly proud of the fact, I happened to know quite a few curse words and I did mutter most of them on yesterday’s decline and of late. No, it doesn’t fix anything, save for exhausting the emotion of these deliberate price rigs and forcing me to reflect on what’s occurring objectively. What’s occurring is that the commercials are rigging prices as low as possible to induce as much non-commercial selling as is possible.
We know this is occurring because on every significant price decline in silver over the past 40 years – with no exceptions – the commercials are always net buyers and the non-commercials, principally the manage money traders, are the net sellers. The next exception to this occurrence will be the first such exception. Therefore, we can be reasonably certain that this Friday’s new COT report will feature further improvements in the market structure for silver (and gold).
Silver prices were quite stable over the first four trading days of the reporting week, but still traded below all the key moving averages, suggesting no real reason for the managed money traders to buy and continued reason to sell. I believe that was reflected in the roughly 3500 contract reduction in silver total open interest through Monday’s close. On the price plunge yesterday, total open interest increased by more than 2300 contracts, suggesting new non-commercial (managed money) short selling.
Without putting actual numbers on it, I would expect decent improvement in the silver market structure or additional commercial buying and non-commercial selling. If we get that expected improvement, it will most likely result in further new lows in the concentrated short position of the 4 and 8 largest shorts, further setting the stage for these traders not adding aggressively to new shorts on the next rally. I would also imagine improvement in the gold market structure, given the series of new price lows over the course of the reporting week, but I am still scratching my head over the large increase in total open interest over much of the reporting week (although total open interest declined sharply yesterday).
Predicting the absolute price bottom in silver in advance is near impossible, but we can, at least, measure what goes into the making of such a bottom, namely, no additional selling by the managed money traders – whether that selling is long liquidation or new short selling. I will be quite surprised if Friday’s report doesn’t indicate that the gross managed money long position to be close to 50,000 contracts, the lowest of the last year. Likewise, the managed money net long position (gross longs minus gross shorts) should come in close to 20,000 contracts, also the lowest (most bullish) over the past year.
The wild card in silver is whether the managed money traders can be induced (hoodwinked) into going heavily short silver over what I would expect to be a 30,000-contract gross short position in Friday’s report. These traders haven’t been short much more than this amount over the past year, but had at times in the more distant past been as short as many as 90,000 contracts or more (most recently in May 2019).
The managed money traders never made any money when they had been heavily short silver (or gold) in the past and I would hope by now they have come to see they were the patsies at the commercial cheats’ crooked poker game. Of course, that remains to be seen, but it is the critical factor as to whether we go lower in silver. Personally, I can’t see the managed money traders as being so dumb so as to get snookered by the commercials into going short heavily again, but it isn’t up to me whether they are or aren’t.
At publication time, the decline in silver prices since Friday has reduced the total losses of the 8 big shorts by $100 million to $10.3 billion.
Ted Butler
July 28, 2021
Silver – $25.00 (200 day ma – $25.91, 50 day ma – $26.79, 100 day ma – $26.37)
Gold – $1800 (200 day ma – $1825, 50 day ma – $1835, 100 day ma – $1796)


Comments are closed.